I would like to invite interested parties to begin a dialogue on the topic of what defines "attractive markets" for providers in the intellectual and developmental disabilities (IDD) industry. To begin with, let's define a "market" as a state and a line of service. For example, operating group homes in Ohio would constitute a "market."
My intention in doing so is to share some thoughts about this important subject in order to elicit feedback from others. I am not interested in trying to tell you what are "good" or "bad" markets for investment. As I'll get to below, a good or bad market may and often will differ by provider. My interest here is to suggest a collaboration with others to capture everyone's best thoughts on the topic. I hope we can share insights and metrics that might help our community better understand the dynamics in place all over our country. I would very much like to see broad participation by interested parties. If this topic resonates with you, I have included my email at the end of the piece and would welcome your thoughts. If there is enough interest and engagement, I may create a LinkedIn group or similar resource to continue the conversation.
To get this conversation started, I am using this column to touch on a wide range of IDD industry topics, from some basics around defining terms and key metrics to discussion about more complex topics like marketing intelligence and dealmaking.
A Starting Point
I've created a table (Table A) with some key metrics on the IDD industry. To begin with, the total annual dollar spent in the IDD industry is approximately $80 billion. I've listed a breakdown by state in the table. The University of Kansas publishes a report every two years which includes this very helpful information. I've used their information for many years and included some data points here.
Should the total dollars spent per state be considered a good indicator of an attractive market? Perhaps a better question is: when does total annual dollar spend become a useful metric? Is the dollar amount spent per person a better metric? If someone is seeking to consolidate a market, might they consider the overall size, number of competitors, and leverage available through combinations as important factors?
I know that there are a number of buyers in the IDD industry that view markets with a small dollar amount of spend as a disqualifier for any transaction. This does not mean that there aren't wonderful companies and acquisition targets for the right buyer. There have been numerous cases in the field of healthcare mergers and acquisitions (M&A) where a company does the hard work of consolidating a small market, creating a dominant market position, and selling it to a large provider.
Administrative Cost Per State
There is a data point that I've always been curious about, and that's the administrative cost per state. How much of the total spend goes to providers for the care of those with disabilities? How much of the total spend goes to administrative costs? By that, I mean how much is allocated to state employees, county employees, third parties, and others? I would be interested in knowing if anyone has that data or how we might obtain it.
Marketplace Plans
One thing for certain in the IDD business is that you need a very clear plan for success for each market in which you operate. You must understand what you're good at and where that can be put to best use. We've seen far too many instances where companies invest heavily in states and markets without a critical understanding of their own abilities and the risks in that market.
Not all markets are created equally. Not all companies are created equally. Just because one company is succeeding in a market doesn't guarantee the same outcome for others. Putting the right resources in place in the correct markets is very profitable. Getting it wrong is costly, and getting out of those market positions can be difficult.
There's a concept that I first saw in the book "Good to Great" by Jim Collins. He introduced a model called the "Hedgehog Concept." Jim's experience led him to believe that to be successful, you needed to find something you're deeply passionate about, something you can do better than anyone else, and something that fits your economic engine.
Since it's impossible to be great at everything, find a service where you're passionate and where you can be great. The right economic engine means that you'll be rewarded for the work you do on behalf of your clients.
Cost of Living Differs by State
Table A includes a list of the dollars spent by state. While that might be a helpful starting point, it's likely an incomplete analysis. There are wide discrepancies in the cost of living from one state to another. The U.S. Department of Commerce has a Bureau of Economic Analysis that publishes a cost-of-living index by state. I've included this for 2023 in our table. I've normalized the spending by state by the cost-of-living index to get a better measure of the support level in each state. Finally, I've ranked the spending by individual IDD client for the 51 markets (50 states and the District of Columbia). Experience shows reimbursement rates are measured more accurately when applying a cost-of-living index. What are your thoughts on this approach?
Not-For-Profit Organizations and Competitive Dynamics
The IDD industry continues to operate with a substantial number of not-for-profit organizations. In some states, we've seen a preference among referral agencies for supporting them over others. There are states where over 50% of consumers are cared for by not-for-profit organizations. It's unclear to me if this preference for not-for-profits is better for the clients. Perhaps someone has information to share on this topic.
My point in raising the topic is only to ask if the presence of not-for-profits and possible preference should be considered in one's evaluation of an attractive market for investment.
Perhaps a measurement of a market's attractiveness would be better measured by the entire competitive landscape. By that I mean the number of competitors, and their size and strength, might be a better measurement.
Market Intelligence
At one point in my career, I was directed by the CEO of a large IDD company to acquire companies in a certain market. When I inquired as to his interest, he said, "Because we have a small presence there, we're losing money, and some acquisitions would really boost employee morale."
I reached out to the owners of every IDD provider in the state. I executed confidentiality agreements, met with owners, and reviewed financial results. Mostly, I got a lot of bewildered owners asking me, "Why would anyone want to buy here? None of us are making money."
I did not make any acquisitions for that CEO. In fact, my firm sold its operations shortly after that research. It's helpful to have a clear understanding of how well other providers are doing in the market.
Perhaps one way to think of the IDD landscape is that there are both attractive markets for investment and unattractive markets where profitability is unlikely. Within the group of attractive markets, there are strategies for success one can define and follow.
Percentage of the Population Receiving Supports
I've never seen research on the incidence of IDD by region of by state. I've assumed that IDD shows up as a percentage of the population regardless of all other factors. It's concerning when you see states with a very low percentage of the population receiving supports. Is this a helpful measurement?
Allow me to make another point about population. Our table shows a total of almost 1.6 million people receiving aid. Other studies, including one recently published by the University of Minnesota, shows that there are approximately 8.4 million people in the country with IDD.
Spend Based on Services Provided by Each State
Each state has its own approach to the IDD services provided and their funding. Some services are obviously more expensive than others. A state offering less expensive services might spend less than another based only on the mix of reimbursed services. Normalizing costs across service lines can be accomplished easily.
A similar point regarding services funded is the direction a state is trending with supports by service. Getting ahead of the changes is smart business. Expansion of services through organic growth or acquisitions has been proven very effective.
Payors
The consideration of payors is a critically important one. There are many subjects that we could get into under the heading of payors. Due to both its importance and the volume of material, I have chosen to park this topic for either another article or open it to an online discussion. I would very much like to hear others' perspective on payors.
Dealmaking
There are over 30,000 providers of IDD services in the U.S., and many of them consider a sale every year. The number of providers means that even after consideration of unusually long ownership periods, hundreds of providers can come up for sale in any given year.
We speak with buyers and sellers daily. We are uniquely positioned to be of help. Having worked with hundreds of buyers, we know the target geographies, services, and sizes of all the large buyers. We know the track record of buyers getting from a letter of intent phase to closing. Frankly, we know which buyers are most efficient and easiest to work with. This kind of experience and knowledge invaluable to sellers
Dave Turgeon, CM&AA
VERTESS is an advisory firm that works exclusively in healthcare. The behavioral health industry has been a foundational piece of the firm's business. Tom Schramski, one of the firm's founding partners, spent his career in this specialty. More recently, I, Dave Turgeon, have managed the behavioral health space for the firm. I transitioned to a focus in behavioral health M&A after working for decades in broader healthcare M&A. The transition was based on a family member with IDD and the desire to help those in the IDD industry who provide supports and services to this population.
Contact Dave at dturgeon@vertess.com or (617) 640-7239. He welcomes your feedback and input!
Volume 10, Issue 15, August 1, 2023
by Dave Turgeon, Managing Director, and Jack Turgeon, Senior Consultant
In today's ever-changing market, businesses must remain keenly aware of emerging trends and swiftly adapt their strategies. As we enter the midway point of 2023, it is evident that the market is undergoing significant fluctuations driven by macroeconomic forces and evolving financing dynamics. This article aims to illuminate these transformative shifts and provide valuable insights into how healthcare businesses can successfully navigate this dynamic landscape. By gaining a comprehensive understanding of the current market conditions and taking proactive measures to prepare for the future, businesses can position themselves for resilience and growth amidst the uncertainties that lie ahead.
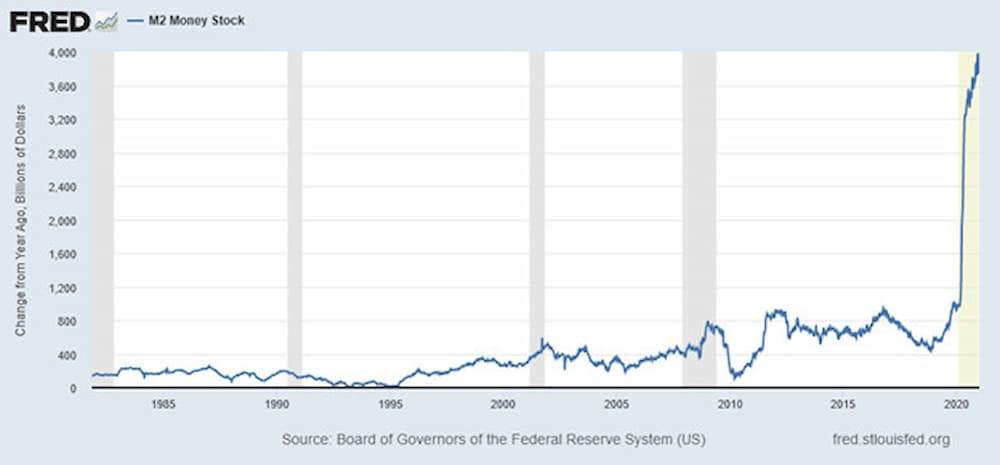
Let us provide some points of reference to help you better understand where we sit today. Since 2008, our government and central bank have been promoting highly accommodative policies intended to stimulate economic growth. They were installed after the 2008 financial crisis. Interest rates have been kept low, we’ve been printing records amounts of money, and the federal government has spent aggressively. When COVID-19 hit, stimulus ramped up even greater, as the chart below of money supply from the American Institute for Economic Research shows. Asset prices increased dramatically. None of this, by the way, is political or depends on your personal opinion of large vs. small government. Following record inflation in 2022, the Federal Reserve has pivoted. In the past 15 months, we’ve had 10 interest rate hikes and at least one more is likely.
In March 2023, Public Television and Frontline released a documentary titled "The Age of Easy Money." The episode clearly explains how we got to this moment and what it means for our future. It can be viewed on YouTube. We reference it because business owners should consider watching it. The program provides valuable insight with historical perspectives and the opinions of experts.
What's transpired during this "age of easy money" is that banks allowed buyers to borrow much more to finance acquisitions than was the historic norm. In 2022, for example, the leverage on the private equity-backed purchases in the United States reached an all-time high of 5.9x EBITDA, according to PitchBook. This unprecedented amount of leverage helped finance one year after another of record numbers of M+A transactions. As the Frontline documentary points out, such free flow of money is coming to an end.
We are now seeing two changes in the market. First, we’re seeing interest rate increases. Everyone sees those, and they’re easy to measure and understand. The cost of debt is more expensive. That means today's asset prices are getting depressed because the future value of discounted cash flows is less. The second change, which is equally important and less well understood, is that the leverage offered by commercial banks is getting more restrictive.
Changes in Financing Deals
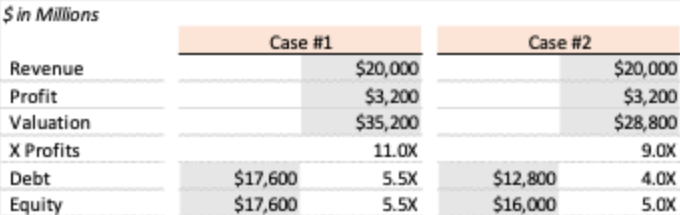
We are seeing the impact of these two dynamics on deals today. We are in daily dialogue with buyers about how these issues are affecting valuations. In the table below, we provide two cases to show the impact of the change in leverage ratio and valuations. For simplicity, we'll use one line item to represent "profit," and we'll ignore taxes.
Case #1 is a view of a transaction that's been fairly common. A buyer pays 11x EBITDA and finances it with a combination of debt and equity. Case #2 shows the impact of a change in bank financing on overall valuation. You'll note that the overall valuation drops from $35.2 million to $28.8M (almost 20%). The multiple of profits drops from 11.0x to 9.0x, driven by the decline in the amount of debt available to finance the deal. While a buyer may need to come up with more cash at close (as percentage of overall deal), they are not making up for the drop of the bank's portion of the financing.
What Does This All Mean to Buyers?
A more restrictive policy of banks is playing out with buyers, including larger companies consolidating businesses. If you've been acquiring businesses based on an assumption of sustained low interest rates and strong leverage ratios, these changes pose a challenge. You're likely carrying too much debt, and your interest expense is rising. You're reviewing all your options. Do you invest more equity in existing companies? Lower valuations on new deals? Look for different deals? Push for more rollover equity on new deals to de-lever your own balance sheet? Seek mergers where the combined entity can save costs and get an even higher valuation? It's fair to say that everything is on the table but paying high multiples for new deals is unlikely.
Outlook and Steps for Business Owners
While it's undeniable what's happening in today's market, one can speculate on what's likely to come next. It would be understandable for sellers to think, "If values are low now, I'll just wait for a later time to sell my business. I'll wait for leverage ratios to go back to where they were." In our view, this would be a mistake. If we are truly at the end of the age of easy money, then we are returning to a more normal period of asset prices and valuations.
It’s unlikely the decline in asset prices will be immediate. Stanley Drunkenmiller, the highly regarded investor, recently talked about how the stock market is likely to trade with very small returns for 5 to 10 years. His view is that asset prices are overvalued and will need years to correct. We'll likely revert to historic norms in all asset classes. The valuations paid for small and medium-sized businesses in the coming years will revert to the norms that have existed for decades.
There are steps business owners should take now to prepare their business for an eventual sale, which include the following:
Start with a valuation of your business as of today. As VERTESS, we provide free business valuations based on your financial performance and other metrics.
Understand the market for your business. This is an area where it's more important than ever for business owners to work with quality M+A Advisors. We can share with you how buyers are approaching businesses like yours and what successful transactions have in common. We can talk with you about comparable transactions and buyers.
Put together a plan for how to increase the value of your business. A good M+A advisor will provide you with a list of questions buyers will ask and the metrics most important for your valuation.
Learn what's needed to stand out among other businesses going to market. This includes highlighting qualities that might be hard to quantity but drive value. Buyers are generally reviewing many opportunities simultaneously. We want work with you to clearly define what makes your business uniquely valuable. It can include your culture, brand, management team, market position, competitive dynamics, the repeat nature of your revenue, or many other factors.
Hand holding wooden block with target aiming dart board and arrow up on blue background. Business achievement objective goal and project progress growth value processing marketing financial concept
Positioning Your Healthcare Business for Success
To summarize, the healthcare industry is experiencing significant changes in the market, driven bymacroeconomic trends and shifts in financing deals. The age of easy money, characterized by historically low interest rates and high leverage ratios, is coming to an end. It is important for healthcare business owners to understand the evolving market conditions and take proactive steps to prepare for a future sale. While waiting for leverage ratios to return to previous levels may seem tempting, it is crucial to recognize that we are entering a period of normalization in asset prices and valuations. Business owners should work with quality M+A advisors to conduct valuations, develop strategies to increase business value, and highlight unique selling points to stand out in a competitive market. By understanding buyer expectations, focusing on key metrics, and differentiating their businesses, owners can position themselves for successful transactions in an evolving market landscape.
VERTESS is an M+A advisory firm that works exclusively in the healthcare industry. Our focus is on helping our clients achieve their goals, including those discussed above. A large portion of our business is "sellside" work, meaning we help business owners prepare and sell their business. We were recently recognized as one of the top investment banks serving the lower middle market, generally defined as deals with valuations below $250 million. To learn more about VERTESS, our services, and how we can help you better prepare for a sale, please reach out to us through our contact information provided below.
Volume 8, Issue 20, December 21, 2021
I’m constantly asked by potential clients, “What can I get for my business?” This question is often followed up by them telling me they’ve heard of similar companies selling for extraordinarily high prices. Those prices are often expressed as a multiple of revenue or earnings before interest, taxes, depreciation, and amortization (EBITDA). They’ll apply a multiple to their business and tell me they’d be happy to sell at that price. While this is not an unreasonable approach, oftentimes the multiples they’re using are not realistic.
Like our other SalientValue articles, my goal is to speak about the market and hopefully be a valuable resource to you. In this article, I’ll talk about the market and provide some perspective from the buyer’s side. Sellers often don’t consider the buyer’s considerations and process, but these are essential to completing a successful sale. I want this article to be helpful to business owners as they consider their best options for pursuing and completing a sale.
As always, if you have questions about this article, I hope you’ll reach out to me via email.
Capital Driving Acquisitions
First, let’s talk about capital. Today’s market for buying privately owned businesses is large and growing. There’s an abundance of capital looking to be deployed in these markets. For the most part, that capital is sitting in private equity (PE) funds. As I write this article, the amount of capital, or “dry powder,” seeking investments is almost $2 trillion. That's the largest in history.
That capital was invested into PE funds largely by pension managers, insurance companies, university endowments, and high-net-worth individuals. Money managers have been allocating more capital into PE because it has generated better returns than other options, including the public markets, real estate, and others. PE firms compete for capital from investors, and they’re judged on their performance versus others. Capital seeks its best use and highest returns.
Most people expect PE’s returns to continue to be strong and more capital to be deployed in the private markets. That will mean even more investment capital available and more transactions in the coming years. Keep in mind that 2021 has been a record year in terms of the number of transactions and capital invested.
As of this writing, we have a lot of liquidity in our capital markets. The forward-looking price earnings ratio of the S&P 500 is 21.3X. At the same time, you can usually acquire privately owned companies for less than 10X their trailing earnings (Note: Public companies are generally valued on a forward-looking basis while private companies are value of trailing 12 months). There are many reasons for this difference in valuations, including risks and liquidity, and this disparity in values is driving some of the investment decisions.
Private Equity Firms
In a future SalientValue article, I’ll explain the PE model in more detail. For this article’s purposes, I want to point out that there are over 10,000 PE firms, family offices, fund-less sponsors, and other entities acting like PE.
Keeping track of all these firms and their focus is a significant effort. In general, the firms are organized by size and expertise. At VERTESS, we specialize in healthcare, and we monitor the buyers for every kind of business within the industry. That includes transaction size, specialty, geography, prices paid, holding period, capital to invest, and investment thesis.
The Buyer's Perspective
Now let's dive into how buyers typically approach an acquisition.
Starting Point
For most of my career, I ran the acquisitions efforts for public and PE-backed organizations. We devoted our energies to figuring out our best use of capital. It meant finding the greatest returns by combining companies in ways that made them more valuable than they were on their own.
We’d start each year with a budgeted amount of capital. For example, our budget might be to invest $80 million dollars during the year. Our success was measured by two criteria. First, did we deploy that capital within our return requirements? Second, did the closed deals achieve successful outcomes, with successful outcomes meaning our operations teams achieved their expected or pro-forma results?
To deploy our budgeted capital, we needed to look at and negotiate with numerous companies — far more than what we were budgeted. If we had a budget of $80 million, we’d be speaking with the owners of businesses whose aggregate value was over four times that amount. Some conversations with these owners went on for years.
The Buying Process
The buyer's evaluation process is several steps. First, the target acquisition must meet certain characteristics to be considered a fit. This is a binary yes/no decision. From there, targets are prioritized based on several factors. One factor is the purchase price.
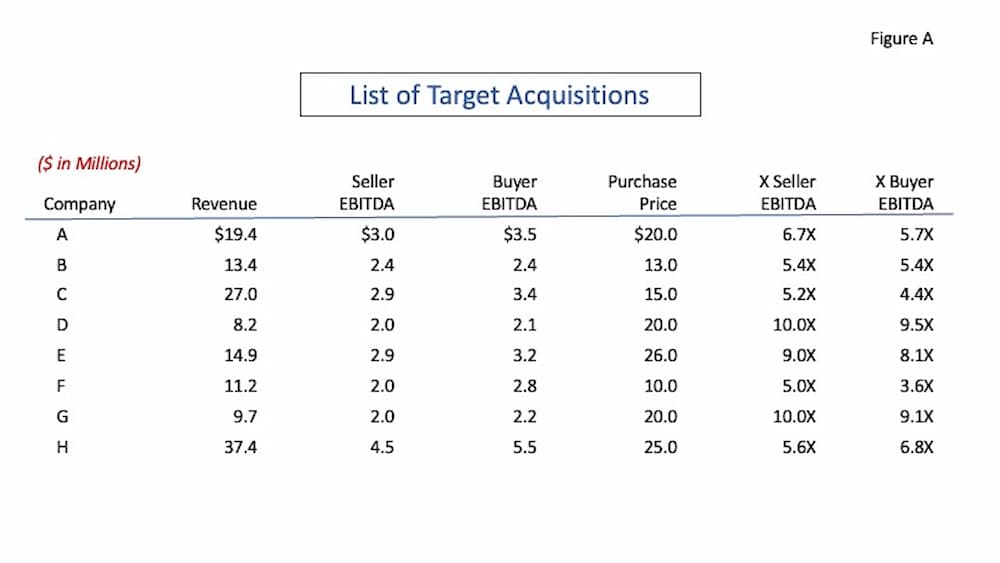
Buyers estimate how much EBITDA a target acquisition would generate for them by creating a pro-forma income statement. They might start with the seller’s EBITDA and then add costs savings and revenue enhancements to calculate what the buyer believes it can generate under its ownership. Assume a seller generates $3M of EBITDA and that a buyer may be able to consolidate back-office operations, achieve better purchasing power, and negotiate higher reimbursement rates. A buyer may be able to generate $3.5M of EBITDA for the same business. The buyer will consider a purchase price based on both the seller’s and its own EBITDA.
Sellers generally don’t know and never learn the buyer’s EBITDA. Every buyer calculates that amount for themselves as benefits and opportunities for one buyer may not be available to another. Comparing seller multiples among transactions does not provide an accurate or complete picture. A buyer may pay 9X seller EBITDA, but they may be paying 7X the buyer’s EBITDA.
Figure A below is an example of a buyer’s spreadsheet listing all target acquisitions available to a buyer at a given time. The purchase price is included, as are the multiples of seller and buyer EBITDA. Deals are prioritized, in part, based on the purchase price. The price paid has a significant impact on your return on capital.
When a seller is demanding a price that’s out of line with what other similar companies are willing to accept, they’re deemed less attractive. You may hear a buyer utter the words, “Why would I pay someone 9X EBITDA when I can buy that same EBITDA for 6X?” When I was buying companies, I was seeking deals in 18 different metropolitan areas. If a seller in Phoenix, Arizona, wanted 10X EBITDA but a seller in Dallas, Texas, would take 5X (assuming similar businesses), then I’d buy the Dallas business.
In Figure A, you can see the options available to the buyer. This analysis is constantly changing. Target companies are added and deleted. Purchase price negotiations go on, and that leads to changes in valuations and priorities.
Markets are also in a constant state of change. Buyers monitor what others are paying for businesses. We recently saw a large company in the intellectual and developmental disabilities (IDD) space sell for a larger value than most people expected. It was higher than previously closed comparable transactions. The PE firms invested in this space didn’t take that as a negative signal, meaning they’d need to pay more for other companies. Rather, they saw it as a positive because when they go to sell their business, they can expect to receive a larger exit price.
Regarding buyers, keep in mind that a buyer is not looking to acquire every company they're talking to. They're not looking to buy every company that meets their return requirements. They're only looking to buy enough companies to meet their budgeted acquisition spend. They're content to invest capital in the current year on those opportunities they can acquire cheapest.
When a seller comes to market, they’re competing with all other sellers in the market. They’re competing for the capital that will be spent in any given year.
The Market
As discussed, there’s currently a significant amount of capital seeking deals and buyers are very busy. At the same time, there are many private companies seeking to exit. One important characteristic of today’s sellers is the high number of baby boomer business owners seeking to transition to retirement. The large number of buyers and sellers are driving the unprecedented volume of activity — roughly 7,100 transactions in 2021.
There are many sources for estimating the number of sellers today. The Small Business Administration estimates approximately 27 million small businesses that generate roughly half of our country’s gross domestic product. The point is that buyers have a lot of sellers to consider in their buying process. Multiple options for buyers are keeping the prices from moving higher. It’s a perfect example of supply and demand.
VERTESS tracks the total market and sellers for each of the verticals we support. That number is more relevant than the total U.S. market.
Advising Clients
It would be almost impossible for a business owner to get the best value for their business by simply working with a buyer who called them. The markets are so abundant with buyers that an owner’s best option is to wisely market their business to all quality buyers. That means finding an advisor who understands their market, knows the buyers and their needs and wants, and can construct the value proposition accordingly. The advisor essentially creates the market for each client.
For years, it was understood that in 3 out of 4 transactions involving an advisor, the seller never heard of the buyer of their business before the transaction. As the markets have gotten busier, that 75% figure has been rising. Assume for a moment that you asked a business owner to list all the buyers that would be interested in acquiring their business. For every buyer they list, there are now four others that the business owner never heard of. This is one of the most important reasons sellers should use a knowledgeable advisor.
At VERTESS, managing directors specialize in specific areas of healthcare. That allows us to dedicate all our time and efforts to just one or a few areas and gain a deep industry knowledge. It allows us to work with dozens of buyers to understand their goals at any time. It allows us to represent our clients better than others possibly could. For example, I completed a large transaction at one point in seven weeks (from first meeting to the close). The buyer was willing to pay a significant premium but needed to complete the deal prior to their year-end.
Negotiating Transactions
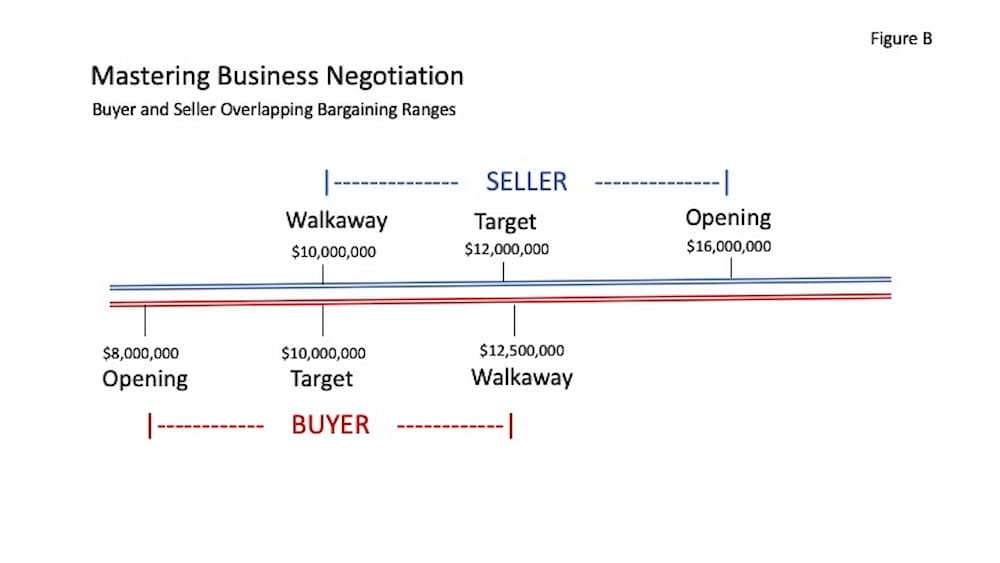
Figure B was recreated from the book "Mastering Business Negotiation," written by Roy Lewicki and Alexander Hiam. Buyers and sellers have ways they approach a transaction. The authors of the book created this diagram and use the terms "opening," "target," and "walkaway" prices. This diagram and its concepts can be helpful for sellers as they think about the process from both sides. To get to a transaction, there must be an overlap of values for the two parties.
I’ve also included this diagram to make a particular point. As mentioned, I used to be a buyer. I can’t tell you the number of times I was able to acquire a business at values well below what I was willing to pay. I’d ask a business owner what they wanted for their business, and they would give me an answer. This figure was often less than half of what I was willing to pay. We were negotiating with more owners than we could acquire. Owners were negotiating without the help of an advisor. We took advantage of the situation.
Concluding Thoughts
My goal now, and what I do at VERTESS, is to help business owners get their very best deals when they’re ready to exit. To put that in the context of Figure B, I want sellers to get a value at the top of the market and as high as a buyer is willing to go (up to the buyer’s “walkaway” price.) To accomplish this goal for our clients, we specialize and understand markets better than others. We know how to market businesses and the buyers that are most likely to get to close and pay the highest price.
I started this article by citing the seller’s popular question, “What can I get for my business?” If you asked me this question, the answer I’d give is that we will provide guidance in terms of similar transactions, and you can trust me and my colleagues at VERTESS to follow a process that will lead you to your best results. We’ll manage the process from beginning to end in a transparent fashion that should give you comfort and confidence in the end results.
COMMITTED TO CONSTANT IMPROVEMENT?
Want to stay current with trends in the medical/healthcare space as well as receive expert advice of veteran medical entrepreneurs?
SUBSCRIBE TO OUR BI-WEEKLY NEWSLETTER VERTESSPRESS
For over 10 years, we've been teaching ways you can improve the value of your healthcare company, focusing on informing you about mergers + acquisitions, including M+A trends in the healthcare market.